Senior Field Project: GC Team
A Glance at Trending Technologies - A Senior Field Project by Xi, Xin, Giang
Brandeis, Spring 2016
Objectives
Modern websites, mobile applications and open source projects are composed of many technologies and services from a variety of vendor. The relative popularity of these components is of interest to both developers and investors. The goal of this project is to research and test several discovery tools.
Methodology
We first came up with a Technology Whitelist that lists out the interesting technologies and their “signatures”. A technology signature can be anything from HTML tags to IP addresses linked to a known service.
Regarding data sources, we decided to dig deep into three realms: CommonCrawl, GitHub, Reddit and HackerNews. Refer to our linked paper report for the detailed work on each data source. For our demonstration, we narrowed down our search to 5 interesting technologies: Jquery, AngularJs, Ionic, React and Hubspot services.
Results
Our final result consists of several graphings demonstrating the use of websites and technologies from CommonCrawl data and allows user to search for repo of interest on GitHub (BONUS: the repo data will also return with a hotness score)
Reports
The final report and presentation can be found with the links here:
Common Crawl
CommonCrawl data provides us with the usage trend of those aforementioned technolgies as well as the top six most active websites in the 18 months of data available.
Technology Usage Trend
Click to see JQUERY USAGE TREND
Technology Usage By Month
Click to see Dec 2015
User needs to specify month and year to see the statistics for that month. More can be found in this folder
Website Crawled Visits By Month
Click to see Dec 2015
User needs to specify month and year to see the statistics for that month. More can be found in this folder
GitHub
Here we show some sample data from GitHub research
Trending: jQuery as an example
Scoring: grit as an example
grit is one of the earliest repo on github. It's final score is: 912.166
Here are the break down:
- Owner's username: mojombo
- Owner's Reddit score: 1.0
- Owner's HackerNews score: 3.69
- Repo's commit history score: 48.42
- Repo's fork history score: 21.049
- Repo's issue event history score: 124.98
Also for your reference are:
Code
Common Crawl WARC Examples/                 working example of exploring WARC files
CommonCrawJavaFiles/                        all java files for Common Crawl
GithubLanguage/
    analysis/
        commit_history.py                   gets the commit history
        dbservice.py                        connects to the local database
        fork_history.py                     gets the fork history
        fun_facts.py                        few fun facts about github repos
        get_keys.py                         gathers the attributes returned by github api
        history.py                          wrapper for commit, fork and event history
        issue_event_history.py              gets the issue event history
        language_stats.py                   gathers statistics of language used in repos
        OAuth.py                            prepares github access token
        repo_user.py                        reports users contributed to the repos
        run.py                              interface for shell script's default run
        score.py                            calculates the history scores
        search.py                           searchs for repos
        user_stats.py                       gathers statistics about users
    json_to_sqlites.py                      dumps json's from api calls to sqlite3
    repositories.py                         downloads repo infomation from github
    Shell/
        hackernews.py                       generates the hackernews score
        history_score.py                    reports the history scores
        importPraw.py                       generates the reddit scire
        run.sh                              the main shell script
        RViz.R                              R script to generate trending graphs
Architecture & Design
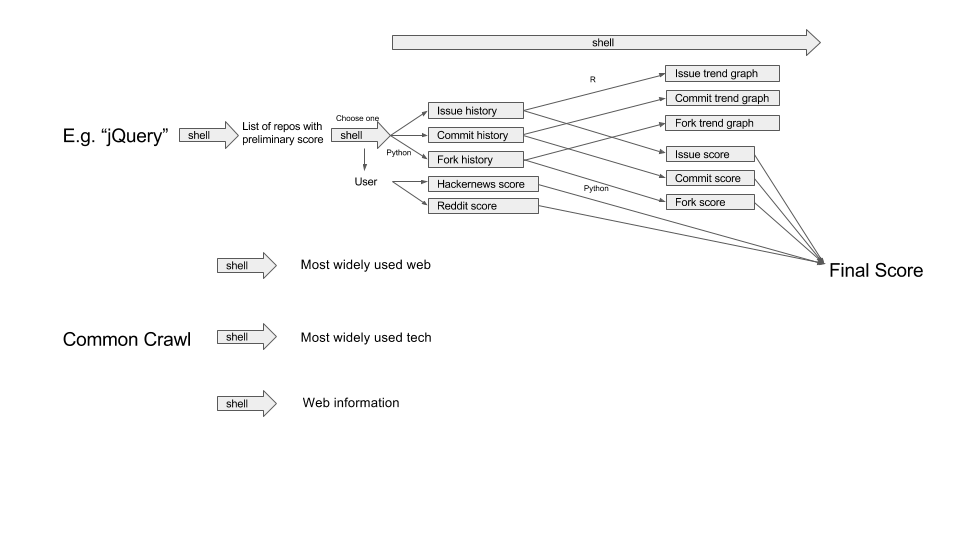
Scoring a Github repo
We found out a relatively smart way to score the open source projects on GitHub. We have the preliminary score which shows first when you search, which is just stars and forks of the repo combined. This pre-score lets us have a quick glance at the repo and once we know which repo we want to see further, the final score is generated. The final score formula is as follows: ( Commit_Score + Fork_Score + Issue_Score ) * ( Reddit_Score + HackerNews_Score)
When we run the GitHub script we have the three history files for commits, forks and issue events. From that we would generate the first three subscores of the formula. A history file tracks the activity of the corresponding type by month. Since we are more interested in the recent technologies, we assign higher weights to more recent months. This results in a geometric weight system that for every month backwards in the past, the value of that month is changed by a multiplier which degenerates monthly as well. We use a 90% multiplier coefficient so the most recent month would be 100% of value, the next ones would be 90%, 81%, 72.9%, … of value. For the Reddit and Hacker News score, we would take the log base 10 of each total karma score of a user from those two sites and then add them together. If the karma score is less than 10 (in case a user does not have an account there), we assign a value of 1 to that score and continue calculating as usual.
Installation
- Github API access token
- Follow the link to aquire your Github API access tokens: https://help.github.com/articles/creating-an-access-token-for-command-line-use/
- Store your access token in
GithubLanguage/analysis/access_token.secret, one token per line - Also copy to
GithubLanguage/access_token.secretif you wish to run scripts outside ofanalysis
- Bash
- Python 2.7
- urllib2
- progressbar
- ipython
- Python 3.4
- Use
python3 -m pip install <package>to specify the python version - praw
- Use
- R 3.2.4
- ggplot2
- PDF Viewer
- Internet Access
Suggestions for Future Work
Common Crawl
If we had more time, we would try to use the new index and query API system of common crawl. This new feature was made by common crawl community in January 2015, which provides an API that allows user to query a particular index for a particular domain, (index is a snapshot for each crawling run they perform), and it will return back results that point you to the location of where the actual HTML content for that snapshot lives. Moreover probably do some semantic analysis with WET files would also be helpful.
Reddit / HackerNews
For possible future continuation of this project, we think it would be better to use Reddit / Hacker News to track a particular interest and use other data resources to get the big picture. Stackoverflow, The Internet Archive and other social media services like Facebook, Twitter, Vk, Weibo seem to have a lot of potential for that. Also, we suggest using our methodology but in a much larger scale, handling big data to get all the scores possible and compare them with each other. If possible, we would try to draw correlations and heatmaps of developers’ associated communities.
GitHub
As suggestions for the future, we can consider more about how to incorporate user’s value into the evaluation of repos. With the history we can find the user connected with each event, and there are repos, other users, and events connect to that user. With some iterations, the evaluation of users and repos may come to a fixed point and that probably will be score we were looking for.
More generally, I would say simply with the GitHub data source alone, it would be worthy of a team’s investment. With more manpower, we can dig deeper into the information behind the tons’ of data. Although we did not follow through our attempt with GitHub Archive and Google BigQuery, these still are great data source and still worth look into. As time changes there will be more and more repos on GitHub. New tools and new information may come into light at any time.
Team Members
-
Giang Nguyen <giangcoi@brandeis.edu>
- Giang is a graduating Senior at Brandeis University.
-
Xi Qian <qxx@brandeis.edu>
- Xi is a graduating Master's student at Brandeis Univeristy.
-
Xin Yao <xyao01@brandeis.edu>
- Xin is a Master's student at Brandeis University.